Pulse Oximetry: Basics

Just tuning in? Start with Respiration and Hemoglobin, or continue to Pulse Oximetry: Application

Once upon a time, the only way to measure SaO2 was to draw a sample of arterial blood and send it down to the lab for a rapid analysis of gaseous contents — an arterial blood gas (ABG), or something similar. This result is definitive, but it takes time, and in some patients by the time you get back your ABG, its results are already long outdated. The invention of a reliable, non-invasive, real-time (or nearly so) method of monitoring arterial oxygen saturation is one of the major advances in patient assessment from the past fifty years.

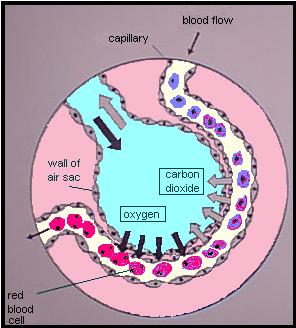
Oximetry relies on a simple principle: oxygenated blood looks different from deoxygenated blood. We all know this is true. If you cut yourself and bleed from an artery — oxygenated blood — it will appear bright red. Venous blood — deoxygenated — is much darker.

We can take advantage of this. We place a sensor over a piece of your body that is perfused with blood, yet thin enough to shine light through — a finger, a toe, maybe an earlobe. Two lights shine against one side, and two sensors detect this light from the other side. One light is of a wavelength (infared at around 800–1000nm) that is mainly absorbed by oxygenated blood; the other is of a wavelength (visible red at 600–750nm) that is mainly absorbed by deoxygenated blood. By comparing how much of each light reaches the other side, we can determine how much oxygenated vs. deoxygenated blood is present.

The big turning point in this technology came when “oximetry” turned into “pulse oximetry.” See, the trouble with this shining-light trick is that there are a lot of things between light and sensor other than arterial blood — skin, muscle, venous blood, fat, sweat, nail polish, and other things, and all of these might have differing opacity depending on the patient and the sensor location. But what we can do is monitor the amount of light absorbed during systole — while the heart is pumping blood — and monitor the amount absorbed during diastole — while the heart is relaxed — and compare them. The only difference between these values should be the difference caused by the pulsation of arterial blood (since your skin, muscle, venous blood, etc. are not changing between heartbeats), so if we subtract the two, the result should be an absorption reading from SaO2 only. Cool!

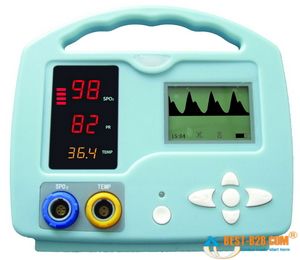
Most oximeters give you a few different pieces of information when they’re applied. The most important is the SaO2, a percentage between 0% and 100% describing how saturated the hemoglobin are with oxygen. (Typically, in most cases we refer to this number as SpO2, which is simply SaO2 as determined by pulse oximetry. This can be helpful by reminding us that oximeters aren’t perfect, and aren’t necessarily giving us a direct look at the blood contents, but for most purposes they are interchangeable terms.) But due to the pulse detection we just described, most oximeters will also display a fairly reliable heart rate for you.

Small handheld oximeters stop there. But larger models, such as the multi-purpose patient monitors used by medics and at hospital bedsides, will also display a waveform. This is a graphical display of the pulsatile flow, with time plotted on the horizontal axis and strength of the detected pulse on the vertical. With a strong, regular pulse, this waveform should be clear and regular, usually with peaked, jagged, or saw-tooth waves. Very small irregular waves, or a waveform with a great deal of artifact, is an indicator that the oximeter is getting a weak signal, and the calculated SpO2 (as well as the calculated pulse) may not be accurate. This waveform can also be used as a kind of “ghetto Doppler,” to help look for the presence of any pulsatile flow in extremities where pulses are not readily palpable. (To be technical, this waveform is known as a photoplethysmograph, or “pleth” for short, and potentially has other applications too– but we’ll leave it alone for now.)

Most modern oximeters, properly functioning and calibrated, have an accuracy between 1% and 2% — call it 1.5% on average. However, their accuracy falls as the saturation falls, and it is generally felt that at saturations below 70% or so, the oximeter ceases to provide reliable readings. Since sats below 90% or so correspond to the “steep” portion of the oxyhemoglobin dissociation curve, where small PaO2 changes might correspond to large changes in SpO2 — in other words, an alarming change in oxygenation status — the fact that your oximeter is losing accuracy in the ranges where you most rely on it is something to keep in mind if using oximetry for continuous monitoring.

The lag time between a change in respiratory conditions (such as increasing supplemental O2 or changing the ventilatory rate) and fully registering this change on the oximeter is usually around 1 minute. And at any given time, the displayed SpO2 is a value calculated by averaging the signal over several seconds, so any near-instantaneous changes should be considered false readings.

Keep reading for our next installment, when we discuss the clinical application of oximetry, and understanding false readings.

Respiration and Hemoglobin

We brought up pulse oximetry several weeks ago, and it seems like a topic worth exploring in detail. What’s this device all about, and how should we be using it?

In order to get there, though, we should really start with some basics of pulmonology and respiration. Don’t worry — we’ll get to the good stuff soon enough.


Oxygen transport physiology

The cells of the human body use oxygen molecules (two oxygen atoms forming an O2) as a vital component of their basic metabolism. Most can survive briefly without oxygen, but not for long and not well.

Delivering oxygen to the cells is a process that starts in the lungs. Oxygen in the ambient air is inhaled into the thin-walled sacs called aveoli, where they easily diffuse across the membrane wall into tiny capillaries filled with blood. (At the same time, carbon dioxide [CO2] is diffusing in the other direction, from the blood out into the alveoli, to be exhaled out as waste.) This oxygen “dissolves” into the blood in the same way that fizzy CO2 is dissolved in a can of Pepsi.

The concentration of oxygen present in arterial blood is a concentration called PaO2, and is directly related to the concentration of oxygen inhaled into the alveoli. (This is referred to as PO2, or the partial pressure of oxygen.) In other words, the more oxygen you breathe in, the more will cross over into the blood. Breathing faster and breathing higher concentrations of oxygen will both achieve this.

Just like in the Pepsi, the amount of oxygen your blood can dissolve is limited by the PO2 of the gas surrounding it. The trouble is that amount of oxygen you breathe in can only produce a very low PaO2  — nowhere near enough bloodborne oxygen to sustain human life. (The kinds of life that can survive on dissolved oxygen alone are the lumpy ones that just kind of roll around from place to place.) So animals like humans have developed a method of carrying far more oxygen in their blood than the fluid itself can absorb. We call it hemoglobin.

Hemoglobin are little iron-based proteins. We have zillions of them in our blood, and they like to cluster into donut-shaped discs called red blood cells (or erythrocytes).

Each hemoglobin has four binding sites where oxygen molecules like to attach. Each site can bind one oxygen, and only one. Four oxygens per hemoglobin is maximum occupancy.

So the process goes like this: We breathe oxygen into our lungs. It disperses across the thin membranes of the alveoli, entering the capillaries, where it dissolves into the bloodstream. This dissolved oxygen is then bound by circulating hemoglobin, like a fleet of buses. These drift downstream until they arrive at the tissue beds — muscle, skin, heart, liver, brain, anything and everything — where the process happens in reverse. The hemoglobin unload their oxygen, which diffuses across the cell walls, and is taken up by the cellular machinery for conversion into energy by aerobic metabolism.

Later, after the aerobic cycle has used up the oxygen, the waste fuel that comes from the other end will be carbon dioxide. This will diffuse back into the blood, where some is bound by hemoglobin, but the majority remains in solution (either unchanged or in the form of sodium bicarbonate); it returns to the lungs, reenters the alveoli, and is exhaled. The cycle is complete.


Oxygen delivery

This whole process is obviously critical. The delivery of oxygen from the lungs to the tissue beds requires adequate function of the lungs, of the blood itself, and of the surrounding environment that allows for oxygen binding and unloading.

In the lungs, this process can be compromised in numerous ways. As we saw, oxygen must enter the alveoli and blood must circulate through the alveolar walls in order for transfer to occur. These two processes are referred to as V (for ventilation) and Q (for perfusion). Inadequacy of either one is called a V/Q mismatch. For instance, obstructive lung diseases tend to decrease the total alveolar membrane available to oxygen — blood is still circulating there, but the gas can’t reach it. This is a failure of V (or shunt). A pulmonary embolism, on the other hand, blocks bloodflow to part of the lungs — you still breathe oxygen into those areas, but no blood is present to receive it. This is a failure of Q (or deadspace). (Obviously, someone who isn’t breathing at all will be inadequately oxygenated in a much simpler way.)

In the blood itself, other problems can occur. First, understand that the total amount of oxygen delivered to your body is not only determined by how much is bound to the hemoglobin, but also by how many hemoglobin are available. A low blood volume — such as in hypovolemia — will compromise this. A normal blood volume, but low hemoglobin count — as in anemia — will also compromise this. An adequate volume and hemoglobin count, but inadequate circulation — low blood pressure and poor cardiac output — will result in a “traffic jam,” with plenty of buses and plenty of passengers, but not enough movement from Point A to Point B.

There can also be problems with either the binding or unloading of oxygen.


The oxyhemoglobin dissociation curve

Adequate oxygen delivery depends on the hemoglobin binding, transporting, and ultimately unloading O2 molecules. As we saw, although oxygen does dissolve into the plasma itself, it is not nearly enough to sustain life; we need those hemoglobin working properly to act as ferries.

Each hemoglobin can bind zero oxygens, one, two, three, or four. How many it binds is directly related to how much oxygen is dissolved in the blood; the more oxygen in solution (PaO2), the more will bind onto hemoglobin (SaO2). If 50% of our total binding sites were occupied by oxygen (for instance, if all of our hemoglobin had two bound oxygen each), we would say our arterial blood is 50% “saturated” — an SaO2 of 50%.

If we graph the PaO2 on one axis, against the SaO2 on the other, we get a line called the oxyhemoglobin dissociation curve. This describes what pressure of oxygen we need to achieve in the blood in order to reach a given saturation of hemoglobin.

Interestingly, this line will not be straight, but rather an S-shaped (or “sigmoid) curve. The reason is that although more oxygen means more binding, not all binding is the same. It takes a fair amount of pressure to bind the first oxygen, but once it’s bound, the affinity of that hemoglobin to bind is substantially increased. It now wants to bind more. Once it binds its second oxygen, its affinity is increased even more; it now takes very little additional PaO2 to bind at the third site. After the third, however, a certain amount of “overcrowding” comes into play, and the fourth binding site has a lower affinity than the third. The curve flattens back out.

Here’s the trick. This curve is not set in stone. It is determined by a number of physiological parameters, which can shift the line to the left or right.

Movement of the line to the right means that for a given PaO2, you will achieve less saturation. The affinity of hemoglobin for oxygen is low; it “doesn’t want” to bind, so you must reach a higher pressure of dissolved oxygen before it will attach to the hemoglobin. On the other hand, since it doesn’t want to be there in the first place, it will very readily unload at the tissue beds. Oxygen is hard to bind but easy to deliver. Factors that shift the curve to the right include: warmer temperatures; acidosis; and high 2,3-DPG (an “unload more oxygen” signaling molecule produced in hypoxic conditions, like COPD, CHF, airway obstructions, and high altitudes). These are all conditions seen in metabolically active states like exercise, where we need more oxygen down in the trenches.

Movement of the line to the left means that for a given PaO2, you will get more saturation. The affinity of hemoglobin for oxygen is high; it binds very readily, so little oxygen needs to be present before it will find a binding site. However, since the affinity between hemoglobin and oxygen is so strong, it will not want to unload into the tissues. It’s easy to bind but hard to deliver. Factors that shift the curve to the left include: cold temperatures; alkalosis; and low 2,3-DPG (of which inappropriately low levels are often seen in sepsis and iron deficiency).

Which do we want? Generally, moving the curve to the right is preferable in critical illness. Although it seems like a problem that we need to get more oxygen onboard, in reality this is usually possible with active medical intervention: we have supplemental oxygen, assisted ventilations, and at the end of the day can always just help someone do more breathing. However, what we can’t do is help them unload oxygen at their vital organs. For someone in a high-demand state, such as the shocked trauma patient, we want to maximize the delivery of oxygen to their body; the last thing we want is plump, well-saturated hemoglobin that refuse to unload their cargo where it’s needed.

Still awake? Tune in next time to hear about how oximetry works and what it should mean to you.

Keep reading with Pulse Oximetry: Basics and Pulse Oximetry: Application

The Rhythm Method


One two three — five six seven

What’s the missing number?

If you said four, congratulations. You have a basic human ability to recognize patterns — one of the best tools we have to separate us from the monkeys and sea-slugs.

One of the simplest types of pattern is a rhythm, and the simplest rhythm is a steady cadence. Ba-dump, ba-dump, ba-dump. Imagine a metronome or a drummer tapping out a fixed, continuous pace at an unchanging rhythm.

This is also one of the most basic and useful tricks you’ll ever use when taking vitals!

See, measuring vitals involves feeling, hearing, or observing a series of fairly subtle blips over a period of time. Unfortunately, interference is common in the field, and it’s a rare day when bumps in the road and bangs in the cabin don’t eat up at least one of those blips.

When taking a radial pulse, if over 15 seconds you count 18 beats, you have a pulse of 72; but if just a couple of those beats are lost due to your movement or the patient’s, suddenly it becomes 64, which is a substantial difference. This is no good; we want better reliability than that.

Rhythm is the answer. A pulse is typically a regular rhythm. So are respirations. So are the Korotkoff sounds of a blood pressure. In order to establish this rhythm, you only need to hear two consecutive beats, and appreciate exactly how far apart they are. If you can do this, then you can continue to mentally tap out that pace — hopefully, while continuing to feel, see, or hear the true beats, which will help you to maintain the right speed, but even if you miss some, you’ll still have your mental beat to count. Even if you miss most of them!

So you feel for the pulse, and you palpate the first couple beats. Then you hit a tortuous section of road that throws you around the cabin, and you’re unable to feel anything for several seconds. But you already had the rhythm in your head, so when you pick up the pulse again, you haven’t lost the count — and you’ll end up with an accurate number.

Now, in sick people these rhythms aren’t always regular. And if you observe that a pulse or respiratory cycle isn’t regular, then this system won’t be as effective — for instance, there’s not much point in trying to find the “beat” to an A-Fib pulse. But small irregularities or breaks in the rhythm are okay, as long as there’s still a regular cycle underlying it; for instance, occasional dropped (or extra) beats won’t change the basic rate.

Give it a try. If you got rhythm, vital signs will never give you trouble again.

What it Looks Like: Agonal Respirations

See also what Jugular Venous DistentionSeizures, and Cardiac Arrest and CPR look like

Education and experience are both important to making a well-rounded provider, and each of the two have distinct advantages. Perhaps the greatest advantage of experience is that it gives you the best ability to recognize situations you’d otherwise only know by description or by photograph.

Nowadays, though, with the Wonders of Modern Technology, we have some tools that can help bridge this gap. Experience is still essential — but there’s no reason that the first time you see a seizure or cyanosis should be in a situation with real stakes.

So let’s go through some of the common medical events and conditions we talk about, learn about, but may not truly know the presentation of until we encounter it.

Today, it’s:


Agonal Respirations

Agonal respirations are an inadequate pattern of breathing associated with extreme physiological distress, particularly periarrest states (that is, it is usually seen just prior to cardiac arrest, as well as during and for some time after). Although not always seen during arrest, it is not uncommon, and there is some evidence that it may be associated with better outcomes than arrests without agonal breathing. Whatever the case, it can easily be confused for ordinary respiration, leading to the mistaken impression that the “breathing” patient must also have a pulse; this confusion is part of why the American Heart Association no longer recommends checking for breathing as part of layperson’s CPR.

As for healthcare providers, whether we’re able to put the label of “agonal” on it or not, we should be able to recognize from the rate and depth that this is not adequate respiration to sustain oxygenation, and ventilatory assistance (as well as a check of hemodynamic status) is in order. But recognizing the specific nature of this breathing can be a very useful red flag to set your “code” wheels in motion.

Here are a few simulated examples, performed by medical actors. They range in presentation and context.

Finally, here’s a treat — this is a video of a real-life cardiac arrest at a beach in Australia. Starting after the first shock, from 2:39 onward, you can see a great example of agonal breathing. The rest of the video is also a nice example of an honest code being worked in the field — not perfect, but real. (For bonus points, how could their CPR and other treatment have been improved?)

(Thanks to Dave Hiltz for inspiring today’s topic.)

Vital Signs: Respirations

In the eyes of many EMTs, taking vital signs is BLS bread and butter. I’m not sure if I agree, since there’s other butter I’d hate losing more, but unquestionably vitals are something we do an awful lot of and probably ought be good at. Mainly, it’s the big three: pulse, pressure, and respiratory rate (the fourth vital sign is temperature, which is not considered vital prehospitally, and the de facto fifth sign is O2 saturation, which is not always available).

But woe unto the poor freshly-anointed Basic who enters the field and discovers that taking a blood pressure off his classmate at a quiet desk has almost nothing in common with playing hunt-the-Korotkoff on an elderly PVD patient in the back of a vehicle that sounds, to the layman, almost indistinguishable from a steam locomotive. With experience, we figure it out and we get by, but I’m always interested in the tricks that people have come to rely on, and here are some of my own. Let’s start with…


Respirations

The man who said that any blind monkey can count respirations has never tried it on sick people.

The first challenge here is getting away with staring at someone’s chest without giving them the skeevs. Women may be a little more wary about this, but if you’re unsubtle enough even men may ask if you “like what you see.” One method is a classic: while taking a pulse, count your beats and then start counting respirations without looking away or dropping their wrist. It gives you an excuse to stare blankly, and the patient is rarely the wiser. Good multitaskers can even count a pulse while simultaneously counting respirations over the same interval of time, although this is a bit much for my own second-tier brain.

Alternately, you can place yourself out of the patient’s field of vision, a technique that girl-oglers will recognize. In the back of the rig, you can usually pull this off by simply moving behind the stretcher — the captain’s chair is often too far, blocking your vision unless the stretcher is very reclined, but moving to the end of the bench seat is usually far enough and more convenient anyway.

How about the shallow respirations that virtually can’t be seen? You can put a hand on their chest to feel, but this is a little weird in the conscious patient and again betrays your intentions. You’re better off maximizing your visibility. Make sure there are no piles of blankets or folds of clothing in the way, and try watching both the abdomen and the thorax, as different people breathe in different fashions. If you’re still having no luck, auscultate! Place your stethoscope and count from the lung sounds. In fact, respiratory distress patients will sometimes produce wheezes or crackles that are audible from the bedside, allowing you to get a count with the naked ear.

Some texts recommend counting for at least 30 seconds; this is accurate, but feels like a geological epoch. Unless respirations are highly irregular, I count for 15. That does mean that your results will always be a multiple of 4, but here’s a way to improve it: count partial breaths as well. If you start with the chest “up” and 15 seconds later end on a “down,” call it a half stroke — so 4.5 x 4 would mean a respiratory rate of 18. You can get even fancier with quarter-strokes but that may be a little silly unless their rate is very slow.

A final note: “ehhh, looks normal” is not a valid method for counting respirations. There are times for estimation, but one hospital-based study showed that an overwhelming number of patients were documented at triage as breathing exactly 16 times a minute. A statistical miracle! In other words, you’re not as good at eyeballing as you think; take a few seconds and do your job.

For other Vital Signs posts, see: Pulse and Blood Pressure